
MARS SOUTH POLE
FLOOD WATERS
Report #077
November 21, 2004
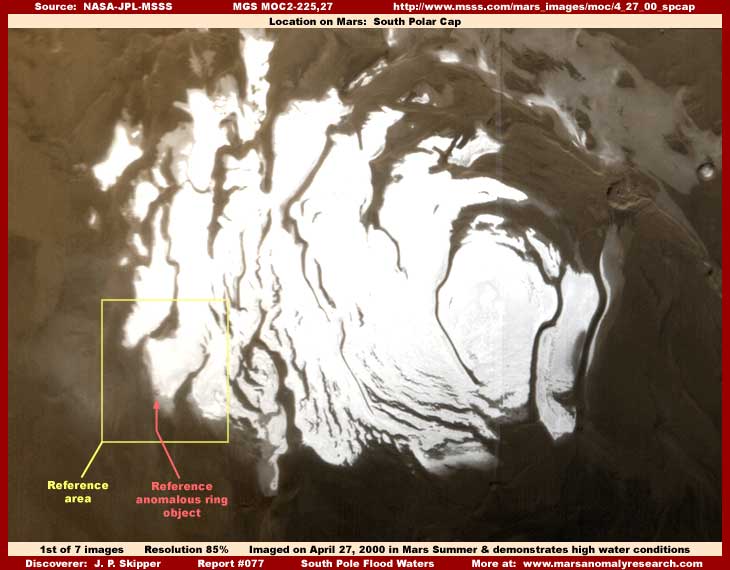
The word "flooding" is of course, to put it mildly, not a concept that you would normally associate with the planet Mars now is it. That sad fact measures the degree to which our perceptions of this neighboring planet have been so manipulated away from truth. Yet, the evidence presented here will demonstrate that liquid flooding is exactly what is occurring at the Mars South Polar Cap, at least as demonstrated in the above first image within the yellow rectangular outline defined area.
In the evidence here in this report, you will be exposed not simply just to substantial liquid surface water on Mars at the South Polar Cap where it is supposed to be so cold, but nothing less than repeated seasonal annual flooding on a massive scale covering a wide region with all of its many implications for life taking advantage of these more favorable survival conditions. You will begin to realize that you are being exposed to a great Mars ecological engine logically insuring the presence of life on the planet.
Actually I have been aware of this particular liquid surface water reality in the 1999-2000 season data since the year 2000. I held back reporting on it until now for two reasons. First, I originally intended to confine it to my book evidence but eventually came to the conclusion that it was too big and complex presentation wise to adequately present in the book's space so limited by the inclusion of other evidence. So I decided to present it here and then later tie the book evidence to it for elaboration. Second, the delay and ongoing releases of additional science data sets over the intervening time provided additional visual evidence for the 2001-2002 and 2003-2004 Mars seasonal cycles reinforcing the interpretability of this revelation even more.
The truth is that to adequately present the complexity of all this evidence would take a huge research work of many hundreds of pages and a great many images. That's out of the question in a book that must also provide space for other discoveries in it. Even this Web site reporting medium will also be inadequate but the basics can still be gotten across, so here goes my attempt.
BACKGROUND
Before we get to the evidence, some background is in order. As you can see in the above first image, the South Polar Cap is cut up by many dark lines or lanes. These are trough systems cutting down into the Cap overall ice mass and the official position will no doubt agree with this. What they will most certainly not agree with is my assessment of how these troughs originate.
You see the official science data says that the Mars atmosphere is made up of 95.32% Carbon Dioxide (CO2) and only a very small percentage of other compounds like Oxygen at .13% and Water (H2O) at .03%. Obviously, if true, the atmosphere is essentially CO2 with only traces of other compounds. Based on that official science data, you can understand how the scientific community would arrive at their official position that the Mars Polar Cap ice masses are made up of solid particulate C02 and not water ice.
Add to this the 1970's Viking probe instrument readings indicating coldest Mars temperatures as low as –225º F. (–143º C.) in the South Polar region. Depending on the source, more recent data indicates cold winter Polar temperature as low as –207 F. (–133º C.) and day time summer warming as much as 80º F. (27º C.) with average temperature around the planet at around –67º F. (–55 º C.). The wide temperature swings are no doubt due in large part to Mars having a more elliptical orbit around the Sun than Earth does. Based on the coldest temperature data extremes, some scientist computer models indicate Permafrost as deep as three miles down into the planetary crust. Now that's seriously cold.
You should be aware that CO2, depending on atmospheric pressure conditions, has a normal boiling off (sublimation) point here on Earth of around –109.3º F. (–78.5º C.) and freezing (triple) point at around –69.8º F. (–56.6º C.) @ 75.1 PSIA. So, the Mars temperature cold would more often than not be sufficient to freeze and strip both the tiny amounts of hydrogen and oxygen, the components of H2O water freezing here on Earth at just 32º F. (Oº C.), out of the atmosphere as well as large amounts of CO2 to fall to the ground and accumulate there as solid particulate snow/ice and build the visible Polar ice masses. You should also be aware that CO2 gas concentrations above 2% in the air begin to cause humans difficulties and above 5% in the air begin to become toxic to Earth humans. To put it mildly, the extremely low Mars temperatures and very dry thin atmosphere combined with probable CO2 ground based snow/ice sublimation defrosting and outgassing into the atmospheric lower levels during warming trends would collectively result in a very hostile environment on the surface for the survival of Earth humans.
It is the foundation scenario upon which the official theories and positions stand. It is the perception that has been repeatedly pounded into our psychology along and along in bits and pieces through the media and educational systems for so long now that generations have grown up thinking of Mars exclusively in this way. Daunting isn't it for anyone who might consider trying to assail this massed now thoroughly entrenched information. You can see why the scientists are so reluctant to depart from this large body of knowledge. It is familiar, further it is safe because it is considered to be a known and done with.
But, is it really true?
The flaw is that this massed unassailable knowledge never contemplated the possibility of a secrecy agenda at work at the foundations bending the data that the knowledge is based on to its ends. The answer, as you will see here, is in their own official science data satellite imaging evidence itself.
The problem is when the presence of a liquid of some kind is confirmed in the Mars surface terrain, in this case in close association with the giant South Polar Cap ice masses. You see, the flaw is that CO2 simply does not have a liquid state and especially not in open environments where expansion is possible and compression impossible. Dry ice is CO2 and anyone who has cooled something with dry ice, with a surface temperature of –109.3º F. (–78.5º C.), exposed in an environment warmer than the ice has witnessed that the CO2 simply sublimates (defrosts) converting directly from a solid state into a gas vapor state with no intermediary liquid state.
Therefore, if a fairly clear transparent liquid is confirmed present in a Mars open surface environment location, such as the evidence revealed here, where expansion is possible and clearly associated with these great Polar ice masses, it simply cannot be liquid CO2. Likewise, since compounds in the atmosphere, other than the more common Hydrogen and Oxygen (H2O), require temperature extremes much greater than even the –225º F. to freeze and since those are the coldest recorded temperatures by their own official instrument readings, these other atmospheric compounds also cannot be candidates for being identified as the liquid you will see here associated with these Polar ice masses. The fact is that it leaves H2O as the only logical and reasonable candidate left.
The key question then becomes can the presence of a fairly clear transparent liquid in close association with these huge Polar ice masses and in significant quantity be confirmed? That is where the evidence presented here in this report and below comes in. Judge for yourself.
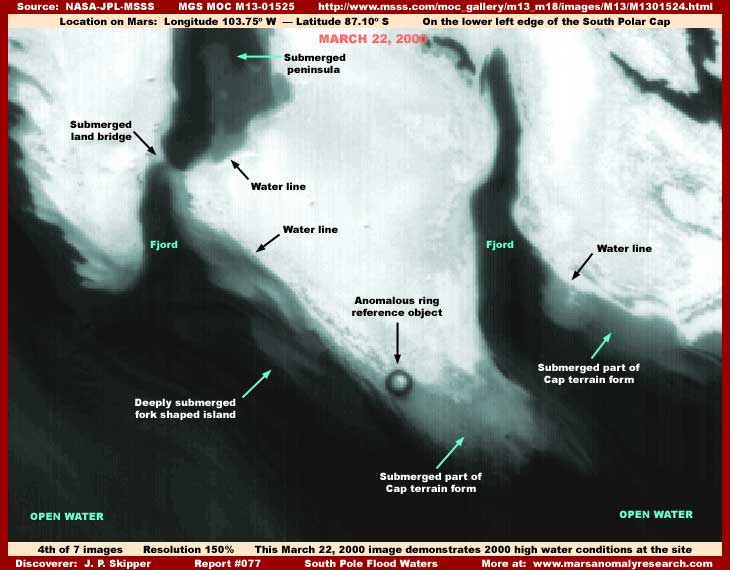
This evidence will be presented in two stages. The first stage consisting of images #2, #3 and #4 below will demonstrate liquid flood conditions for this one particular site as it appears in three different 2003-2004, 2001-2002 and 1999-2000 annual seasons working backward from the most current to the oldest. The second stage consisting of the next three images #5, #6 and #7 will demonstrate dry time conditions for the same site and for the same seasons in the same order. There just isn't enough image space in this report or I would have also shown you the intermediate stages as the site starts filling up with liquid. So you will not see that here.
FLOOD STAGE EVIDENCE
Each of the three flood stage images below are listed closely one after another to better facilitate scrolling back and forth comparison. The small position, closeness and resolution differences in the images are due to differences in the original official science data imaging. I have added a little contrast and some color to mimic the Polar environment to increase clarity but I have made absolutely no alterations. As always, what you see here is verifiable right down to the last detail in the official science data imaging.
Note that, regardless of how much alike these images appear, according to official statistics they were taken roughly a year apart. That fact alone is perhaps eventually the most telling evidence of all, as will become clearer. Note to that they also collectively span a time distance of three months (January, February, and March) based on Earth time and clearly demonstrate in this evidence alone that the high liquid levels conditions persist at least that long and through those particular months.
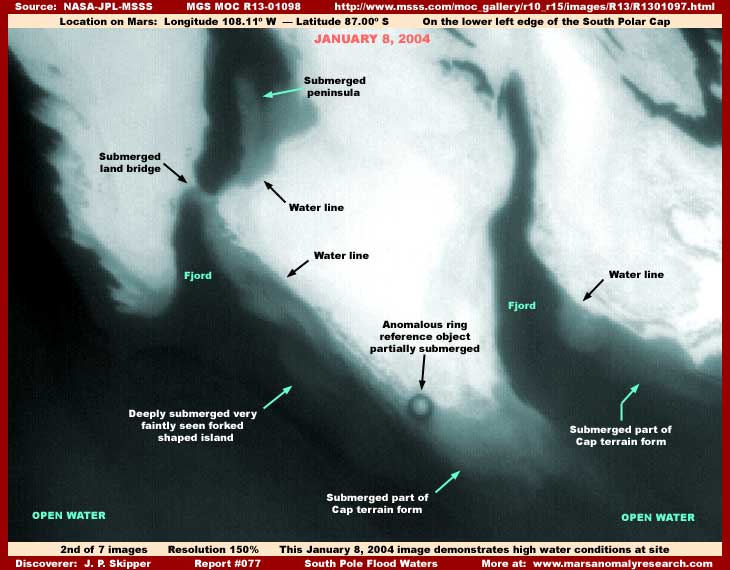
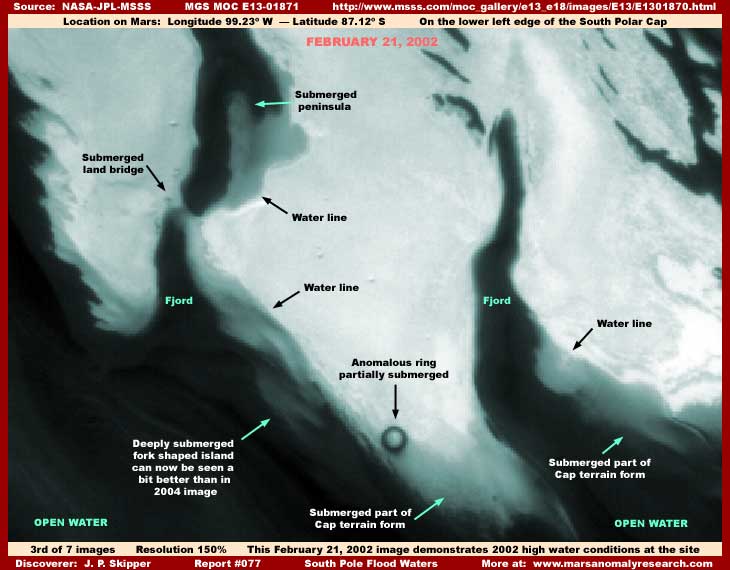
The dark areas in the above three images is a dark tinted flat level liquid. The transparency of this liquid is demonstrated by the fact that the lower portions of the large normally light color highly reflective terrain ice masses are seen submerged through the liquid that of course reduces that portion's reflectivity and intensifies color. The depth of the liquid is demonstrated by the submerged portions of the terrain forms gradually visually fading from view at their lower base areas deeper down in the liquid. The height of the liquid and how universally level it is all around this site is demonstrated by the very clear demarcation lines separating the exposed to the air highly reflective ice mass surfaces from the down below much lower reflectivity submerged surfaces.
Also, in images #2 and #3, please note that the large ice mass on the left is very well seen because of its huge size but is actually subtly less reflective than the two ice masses on the right. Yet, in image #4, this left ice mass is much more reflective matching the other two. Also note that the anomalous ring pointed out in each image is, on a much smaller scale, subtly less reflective in images #2 and #3 but more so in image #4. This evidence indicates that these large and smaller size objects are shallow submerged in the reflectivity reducing liquid in images #2 and #3 and less so in image #4. These are excellent indicators, even in these images demonstrating high liquid levels, that the liquid levels at this site, although they may first appear to be the same, are actually dynamically changing in this regard in the seasonal temperature trends.
This flood stage visual evidence is all very typical of Polar ice masses when seen from a considerable distance above and being partially covered by water here on Earth. The only difference is the visually somewhat greater degree of liquid dark tint as compared with Polar environments here on Earth. This greater degree of darker tint is better demonstrated in the liquid in the smaller trough systems. Here on Earth, these smaller areas of shallower liquid would be more clear and transparent. This is a clue to the presence of dark color tinted life that we will get into here later.
While you're at it, note the consistently dark areas of liquid in the lower and left open areas in each of the above three images. Now compare the above image #4 site taken on March 22, 2000 with the first image #1 here of the South Polar Cap taken on April 27, 2000 a month later in the same year.
Note that, although the liquid flood stage signs are seen up on the terrain ice masses in images #2, #3 and #4 here and on the same ice mass forms in the South Polar Cap image, the area just below and to the left of these Cap terrain ice mass forms in the South Polar Cap image does not show even a suggestion of the extensive deep very dark color clearly evident in images #2, #3 and #4 here. That is due to the smudge image tampering applications in the first context South Polar Cap image covering this dark tinted liquid presence evidence right up to the outer edges of (but not on) the terrain forms and creating a false dry terrain detail illusion extending far out into the surrounding terrain from the Cap ice masses.
The truth is that very little of the true Mars terrain extending outward from the South Polar Cap is real in this scene. Once recognized, note how this visual "stuff" also extends up into the trough systems on the Cap itself covering the dark tint liquid there and giving them a different surface texture as well matching that in the open terrain. All to misdirect away from the perception of a dark liquid being present. It is how secrecy is done in the world of our Earth space exploration programs and what American tax dollars have been paying for. Does this suit you? Getting tired of it yet or just tired of hearing about it from me?
Also, you will note that I have also pointed out the anomalous ring, an island, a land bridge, and a peninsula in the above three flood stage images as reference points and objects. These play some part in understanding the flooded liquid conditions at this site in the images presented here. However, added to this report below will be links to tabular data listing the many images of this site in each of the three seasons. If anyone is so inclined to do their own verification research (scientists?) work behind me, this tabular data can save a lot of research time and these reference objects will play a greater role as they are seen in various water level stages all the way from dry to flooded and everything in between.
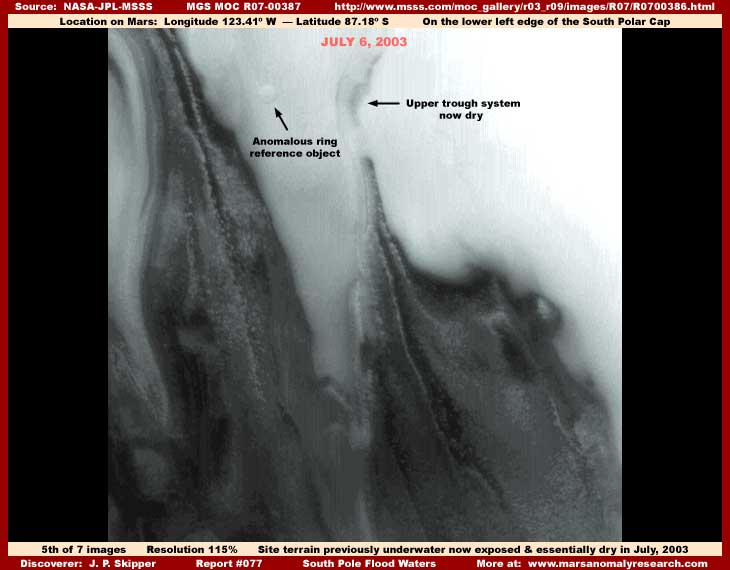
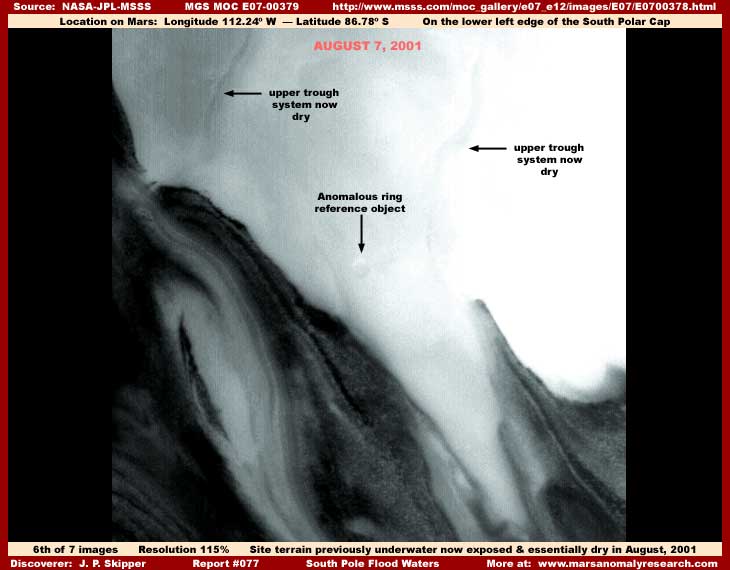
DRY STAGE EVIDENCE
Okay, so much for the flood stage visual evidence, now let's get on with the three images below of the dry stage evidence at this site. Please understand that this may be visually more confusing for many of you because little visually familiar gained from the three flood stage images is readily recognizable in this evidence. That is because of the drastic ice mass form visual changes at the site.
One reason for the visual change is because what terrain detail that was previously completely hidden under the uniform dark tinted liquid is now exposed providing new and different detail. However, it is also because of extensive image tampering here as well. There has been twisting of the image to distort the ice mass forms as well as extensive carpeting direct image tampering applications applied over them, all resulting in a distorting elongated effect. Of course all this could be made a better by presenting a great many images from the tabular data linked to here showing the changes more gradually but that isn't practical in this medium. The only thing I'm really trying to convey to your understanding here is just the dry of liquid conditions (as compared to the flooded conditions) demonstrating considerable and even drastic dynamic change at the site. So don't get too wrapped up in the visual distortions they've produced here in this dry season data.
The key to understanding where you are at and the proof that you are at the same physical site is the presence of the anomalous round ring. It is the visual anchor point in all these flood and dry stage images. In these dry stage images it no longer has its recognizable dark ring appearance and is now seen only as a round light color shallow depression faded out against in the light color terrain background. This isn't necessarily because of colder ice conditions so much as it is because of soft fluffy color coordinated smudge image tampering mostly covering these terrain masses and mapping into the ring depression as well as altering the shape of the terrain masses. We are fortunate that the tampering application is the mapping type and mapped down into the depression or the reference round depression shape would be gone under all this tampering as well.
The three flood stage evidence images above also have image tampering on their exposed surfaces as well but it isn't the complete carpeting overall shape changing deal that has been done in the below three dry stage images. Even so, the dark areas in the below three images at least convey knowledge that the previously submerged ground is now exposed to the air. This isn't a report about image tampering and despite the considerable visual obfuscation, the visuals are still sufficient to convey the understanding of the dry absence of liquid condition at the site as compared to the above three flood stage evidence images. Again, remember that each image below represents a separate year and season as labeled.
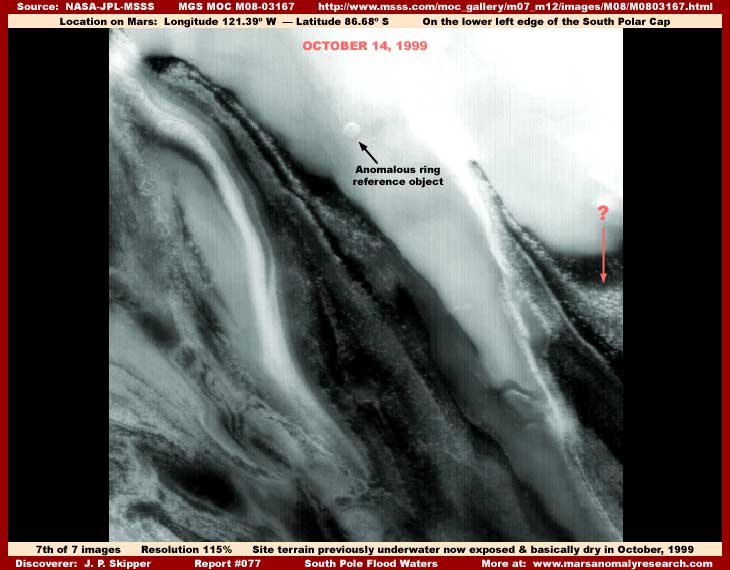
As you can see in the above three dry stage images, the deep dark tinted liquid is no longer present at this site confirming dynamic and fairly drastic change. Compare that with the three flood stage evidence images. The idea that the secrecy agenda is trying to convey here with this kind of manipulated imaging is that the CO2 ice masses thawing and outgassing in the warmer cycle heavily erodes and distorts the ice mass forms. The flaw is that concept is that it is absolutely not possible that the annual rebuilding of the severely eroded ice mass forms during the colder freeze cycle would rebuild and replicate the previous visual ice mass forms so perfectly for its appearance in the next cycle must less in repeat year to year cycles. All clearly evidenced in the three flood stage images covering three years.
Further, the more severe image tampering in the dry stage imaging may also imply something to hide other than the possible presence of residual not quite dried up liquid in smaller spots within this general site. If not liquid, then it is logical to speculate that this is likely the presence of life of some kind previously submerged and hidden by the obscuring deep and dark tinted high liquid level conditions on the bottom now exposed in the dry stages. Exactly what that might be under all this is anyone's guess.
However, what ever it is, it was apparently big and visible enough to readily identify and warrant this complete carpeting type tampering treatment. Some of it is likely biological life but this kind of life is hard to identify because of its smaller size in the distant satellite imaging in the resolutions released. It can only be seen in tangled masses and is often dark in color itself causing it all to blend in with each other visually.
In future reports, I'll give you a look at some of this suggestive biological life evidence and you can judge for yourself. I also have some very strange visuals and you can take a look at that to. Likewise, don't flood me with questions about the anomalous ring revealed here in this report. I'll cover it shortly in another report, so look for information on it there.
TABULAR DATA
I realize that it may be hard for some of you to make the mental adjustment from the easier to interpret three flood stage images to the heavily tampered with and more confusing harder to interpret three dry stage images because of the drastic visual appearance changes in the site. It is easier for me because of my familiarity, more time to adjust, and because I have examined all of the images of this site gaining all of the context knowledge of the dynamic changes at this site that comes with that.
So, for those who wish to know more and gain some of this knowledge and for anyone (scientists?) wishing to research all the available evidence for themselves, the links below will take you to pages with all of the available official science data images of this site listed in tabular form in order of date taken. Note that these pages are just lists without links because there are just too many and you will have to do your own connections. I've tried to make that as easy as possible. At least you do have the list already in order of dates and you can print it out for check off purposes. There are a total of 139 images collectively in all three sets.
1999-2000
Season Images
2001-2002 Season Images
2003-2004 Season Images
If you get into all these various tabular listed official science data images, you must also take some cautions into consideration. When the wide-angle image is presented on the right as a companion context image with a narrow-angle image on the left (first column), the wide-angle image sometimes has the same orientation agreeing with that presented in the image of the South Polar Cap. That is good and why these types of images are listed first in the tabular data pages. However, they are often flipped horizontally to and in that event will require graphics software to flip it back to the orientation agreeing with the South Polar Cap image for easier comparison.
Likewise, when a wide-angled image is presented alone on its own page (second column), the image is almost always flipped both vertically and horizontally often severely distorting the view and will require flipping back to the orientation agreeing with the image of the South Polar Cap for proper comparison. That is why these types of images are listed second in the tabular data.
A FLY IN THE OINTMENT?
Research in many of the narrow-angle images further out in the open dark tinted liquid areas in the flooding season reveals primarily images of the dark obscuring surface covering everything with bottom forms often visible through it but also some images with this dark covering completely missing and only what appears to be dry reflective land detail showing. Here is what I think is going on with such conflicting data just in case someone wants to come back at me and the evidence here in this report with it.
The ice Cap major very large terrain forms that you see in the first three high liquid level images here can be seen and recognized from independent telescopes on Earth. In other words, the Astronomy community is in general familiar with the look of the Cap and its ice mass forms because of its huge size. So covering these ice Cap forms and distorting them is not practical as they have done visually covering these same forms so severely in the dry season images where the drastically changing shapes can be better passed off as the confusion of CO2 ice defrosting and frosting erosion and rebuilding, at least as seen from Earth based telescopes. So, if they can't cover the flood stage Cap terrain form evidence completely, the next best thing is to build in some plausible deniability into the image evidence itself with fake images from other dry areas of the Cap.
Should some scientist with credentials actually catch onto the liquid flood stage evidence as presented here on his or her own (not very likely), be able to get some media attention, break with conditioning, and naively publicly pursue this truth, the secrecy agenda can then simply trot out more "cooperative" scientists in sufficient numbers with this fake dry land evidence from the same area. After all, they control the evidence sources and who is going to prove otherwise beyond what they allow? At the very least, they can muddy the waters enough to promote endless debate that never reaches resolvement and otherwise put this poor sap's hard won credentials in jeopardy.
As for me, I'm a nobody outside the system who came out of nowhere, got information up before they could adjust, and they have no such leverage on me. Further, attacking me would merely draw attention to this evidence record all during the time they were pounding on me and, because the visual evidence often speaks for itself, they definitely do not want that to happen. But, unfortunately, the fact is they have correctly deduced that they can afford the presence of these discoveries as long as the science and academic communities and the mainstream media ignores this evidence and it doesn't get into wider awareness through them. So, they are so far just content to keep this anomalous evidence bottled up in this way and buy time.
It is a sad commentary on the way things work in our Earth human society. The evidence is not judged on its own merit, it mostly isn't even looked at. Rather, it is initially judged as worthy or unworthy of a first look based on very arbitrary views as to the social credibility of the human source. It makes no difference that the evidence is what it is quite apart from the person who discovered it. In general we are herding social creatures heavily addicted to this process and information first has to make it past these shallow prejudgement social filters to be considered.
GENERAL OBSERVATIONS
Examination of all of the various images of this site in the science data indicates that high liquid level conditions at this site on average increase in earnest in mid to late December with flood stage quickly achieved in January extending out at least into February and perhaps March and fairly high liquid level conditions continuing to extend out into May, all measured in Earth time. The driest period seems to extend roughly from July to October and perhaps November with the month of June being a relatively unknown factor because of a lack of adequate imaging data.
It appears that more gradual melt of the ice into liquid form probably is getting started to some extent in October gaining increasing momentum in November and early December. This can be seen in the imaging data to some limited extent but much more visually apparent is the growth of dark masses that can visually be confused with the dark tinted liquid but is not that. This increasing growth is a good indicator of the now increasing presence of melt liquid in the trough systems that it occupies, liquid that is too shallow and clear in these earlier melt stages to be seen in this distant satellite imaging in the resolutions released to us.
Although the wide-angle imaging with its poorer resolution on smaller objects doesn't have sufficient detail to adequately see this growth except as a dark color, the narrow-angle imaging indicates it almost certainly represents biological life of some kind taking advantage of the increasing melt liquid and saturated ground and massing in it in an explosion of life geared to the annual Polar warming and cooling cycles. There is also some evidence in the closer narrow-angle imaging of the general area that some of this life, not only survives the months prolonged high liquid level conditions, it continues to grow and flourish submerged.
This general information correlates very well with the visual evidence of Mars provided from independent telescopes here on Earth of green tinted areas immediately around the Cap visually spreading outward in the Mars Spring and Summer seasonal warming trends and contracting back during the increasingly colder seasons of the year. That is this was the evidence before satellite missions to Mars and the "controlled" data they produced painting a very different picture of the planet being dry and dead with a hostile atmosphere as per the secrecy agenda target goals. The Astronomy science community, if they had enough collective courage, should jump on this new information presented here but I wouldn't hold my breath on it.
However, in my opinion, the degree and depth of the flooding is not adequately explained by just the natural solar melt process of the Cap ice masses. As I have stated previously in report #057 titled "Water Ice Masses: Ecology's of Life" and report #075 titled "Water Ice In Fractured Stratified Layers," there is a dark tinted organism that exists in a great deal of Mars liquid surface and underground waters as well as ice masses that give the water a darker tint.
This organism's presence amounts to solid particulate in suspension in the liquid medium. It absorbs solar radiation in tiny amounts that collectively over its great numbers adds up to a lot of energy heat release into its immediate liquid environment adding increased warming to the liquid. Also, the dying bodies of this organism sink out of suspension collectively coating the bottom and sides of troughs and open areas maintaining a concentrated dark tint there and increasing differential solar heat retention in those areas and increasing melt there, especially when these areas are dryer and more exposed to sunlight in the beginning melt stages. The greater the organism collective numbers, the darker the tint, the greater the absorption of solar energy, the greater the energy release into its immediate environment, and the greater the ice melt conditions relative to adjacent much more highly reflective and therefore colder ice mass surfaces. Add to that the known fact here on Earth that water free of ice debris on the surface, is less reflective and absorbs more solar energy than adjacent very light color highly reflective ice mass surfaces.
The combination of solar energy retention in the liquid results in increased heat release in the trough and open areas previously and currently occupied by the organism and earlier and deeper melt conditions in those specific areas relative to the more highly reflective and less heat absorbing areas of the Cap ice masses. This is how the troughs are carved out of the Cap ice year after year in the same place and shape with such consistency. It is a stable ecology at work and water in ice and liquid form depending on the seasonal warming and cooling cycles is the South Polar engine that enables and facilitates it.
As evidence of this, please reexamine the above three flood stage images. Go over them very closely inch by inch and note all the ice mass features including the reference objects pointed out with labels. The first impression is that each image and the ice mass forms in them looks like the next with nothing much in the way of change. Remember, that three warming and cooling seasons or years are involved here. It is that visual consistency from image to image, season to season, and year to year that is itself telling evidence and a serious clue as to what is really going on here at this site.
The fact is that the ice mass shapes right down to the smaller details doesn't change much from year to year. Any significant changes probably occur only gradually over much longer periods of time than involved here in this evidence. Only when the water levels rise and drop (seen in the accumulated total imaging evidence) can ongoing visual dynamic changes in shape be noted. In other words, the Cap does not physically change to any significant degree from one year to the next as clearly demonstrated in the flood stage imaging spanning three years, only the liquid levels at the site change and this in turn changes the Cap's overall appearance visually as seen in satellite imaging, but not the physical terrain forms themselves.
This insight is significant because the official position is that the Polar Caps are primarily CO2. This compound's defrosting erosion process would of course produce visual and physical changes. However, it would not produce the dynamic liquid you see present at this site since it has no intermediate liquid state in a open planetary surface environment where expansion is possible. Further, if the Cap ice was primarily CO2, although the defrosting erosion of the ice masses caused by defrosting would be substantial similar to what you see in the dry stage images here, the frosting building back up of the ice mass forms in the next cold cycle could not possibly replicate the previous flood stage terrain form's appearance so exactly from year to year over three years as the flood stage image evidence here clearly demonstrates right down to small details.
So, what we have here is clear visual hard evidence that the process of CO2 defrosting from a solid state directly to a gas/vapor state is not occurring at this site. It is obviously just what it visually looks like, the natural process of liquid water levels rising and falling and darker tint biological life advancing and retreating in sync with the changing water levels that temporarily alters the true visual appearance of the Polar Cap (and its outer regions) without actually altering its physical structure and forms. The only other factor that visually alters the appearance of the Cap and its surroundings is an artificial factor in the influences of the visual image tampering and its manipulative misdirection fake illusions altering the visual look of the evidence.
CONCLUSION
At the risk of being too repetitious, the bottom line is that the rising and falling levels of liquid clearly seen present here at this site and in such massive quantity, regardless of the unassailable official CO2 and temperature science data readings and the whole world of science built on this house of cards, can logically only be just what it looks like, normal H2O water. It is very simple because that is the only thing left once the presence of the flaws of the manufactured theory of CO2 is revealed.
It then follows logically that the presence of liquid water demands that the true temperature for an extended period spanning months in every year is at the very least somewhat warmer than the freezing point of liquid water on the surface of Mars. That in turn denies and precludes the official Viking –225º F. (–143º C.) and similar later instrument temperature readings. It is the basic flaw in the secrecy with the eventual result that the mental dominos will just keep going down once the secrecy basics are initially figured out and breached.
Further, once one realizes that all this much water in a liquid state is in the colder South Pole environment and that it could only exist there via milder tolerable atmospheric ground level temperatures as identified by Earth human standards, that has similar implications for such atmospheric and water conditions existing all around the planetary surface and under the surface as well. The presence of so much water in a liquid state logically indicates a more breathable atmosphere for life as we know it regardless of what the science data instrument readings say and that life as we know it can readily exist. Further, it would actually be strange indeed if some of that life had not advanced in intelligence. That is the perception path that the secrecy agenda has worked so hard to bend awareness away from and what the secrecy is all about as one concept leads to another in the domino effect.
We Earth humans have grown up and died for many thousands of generations here on Earth and we are heavily conditioned by our exposure and experiences here to the point of considerable prejudice. If our ancestors came from an Earth like planet somewhere else in ancient times and entered this Solar System and had to choose a planet, which one do you think they would choose as being the most ideal? Do I really have to answer that for you? That is our prejudice. It isn't good or bad, it just is.
However, if someone other than us or even our own ancestors for that matter came here from elsewhere in ancient times, would they necessarily make the same choice of planet as the most desirable one? Think about it. Their choices and opinions as to what would be desirable to them would almost certainly be geared to their experience formed elsewhere.
If they came from a low gravity world or worlds and/or had become acclimated to lower gravity ship life, the intense gravity well of Earth would be a serious inhibiting factor without the assistance of some seriously advanced technology. If they came from a world of mostly land mass with no great seas or oceans or a world of substantially depleted resources, what would be appealing about a world like Earth with 70% of the land under water and only 30% land space for population and expansion relative to Mars as a potential choice with no great covering seas? Remember, there's no place like home or as close as you can come to what you consider its better qualities.
The Earth is larger in diameter than Mars but, since 70% of it is covered by water, most it salt water, Mars is mostly all exposed land and has at least as much or more land space for expansion. The Earth has say 5-6 billion in collective intelligent life populations living on its 30% land mass and steadily overpopulating its resources. If the same scenario was considered for Mars, the population there would be at least as large or larger. The point I'm trying to make is that it isn't easy to break with prejudicial views and put yourself objectively either in the other person's shoes or on their planet and look at through their eyes as to what is attractive about it and what is not.
Yet, some of that objectiveness is very much required in trying to correctly assess the true situation on another world like Mars or even our nearby Moon to for that matter. Mars is an old and stable world and, as you've seen here, it very likely has surface water and reasonable temperatures able to support life as we know it all the way up to intelligent technologically advanced life. Where there are favorable conditions as well as plenty of time and a niche to be filled, you can bet that something will fill it. Life always finds a way.
This report contains some conclusive verifiable evidence of a considerable annual flood water ecology engine at work at the Mars South Pole. Its reality and implications places universal deeply entrenched manipulated perceptions and even considerable official science data in harms way. So, anticipate that the secrecy agenda will not like this kind of evidence one bit. If any scientists with some courage eventually come out of their shells and begin to dig into this evidence in earnest, the crack in the secrecy agenda will begin to widen and the whole fiction thing will start crumbling moving us all toward truth.
That is as it should be. It is the eventual outcome of all persisting duplicity that has long ago worn out and served its purpose and usefulness.
DOCUMENTATION
http://www.msss.com/mars_images/moc/4_27_00_spcap: This link accesses the official science data MOC2-225,27 April 17, 2000 image of the South Polar Cap I've used for my first image in this report.
http://www.msss.com/moc_gallery/r10_r15/images/R13/R1301097.html: This link accesses the official science data R13-01098 wide-angle image as a companion context image for the R13-01097 narrow-angle image used for my second image in this report.
http://www.msss.com/moc_gallery/e13_e18/images/E13/E1301870.html: This link accesses the official science data E13-01871 wide-angle image as a companion context image for the E13-01870 narrow-angle image used for my third image in this report.
http://www.msss.com/moc_gallery/m13_m18/images/M13/M1301524.html: This link accesses the official science data M13-01525 wide-angle image as a companion context image for the M13-01524 narrow-angle image used for my fourth image in this report.
http://www.msss.com/moc_gallery/r03_r09/images/R07/R0700386.html: This link accesses the official science data R07-00387 wide-angle image as a companion context image for the R07-00386 narrow-angle image used for my fifth image in this report.
http://www.msss.com/moc_gallery/e07_e12/images/E07/E0700378.html: This link accesses the official science data E07-00379 wide-angle image as a companion context image for the E07-00378 narrow-angle image used for my six image in this report.
http://www.msss.com/moc_gallery/m07_m12/images/M08/M0803167.html: This link accesses the official science data M08-03168 wide-angle image as a companion context image for the M08-03168 narrow-angle image used for my seventh image in this report.
, Investigator
![]()